Graphical Models for HIV Vaccine Design
David Heckerman
eScience, Microsoft Research
[HIV and Immunology Background]
Treatments are good but expensive and catastrophic if doses are missed (ie. do not work for developing countries)
HIV Life Cycle
* retrovirus
* RNA get reversed transcribed into DNA into human cells
Immune Response:
* antibodies (humoral arm - tried to use for vaccination for 20 years w/o success
* killerT cells (cellular arm) - is this strong enough to stop HIV development?
** epitopes (fraction of protein) bind w/ HLA molecules (HLA "sandwiches" the epitope), transported to the surface of the cell, recognized by T-cells
** how effective against HIV?
*** HLA and epitopes very diverse accross human people
*** HIV mutates rapidly (=> the epitope mutates to escape killer-T recognition)
*** The HIV mutation in a person is correlated to the HLA of this person
first approach found correlation between HLA and HIV mutation,
but actually no correlation with epitope mutation:
approach was based on pure alignment statistics, ignoring the structure of the data (ie. phylogeny): phylogeny alone is explaning a lot of the correlation between a particular motif and a given HLA... basing yourself only on local alignment underestimates the correlation
[Graphical Models to address the problem]
1. build phylogenic tree
2. for each HLA-position pair:
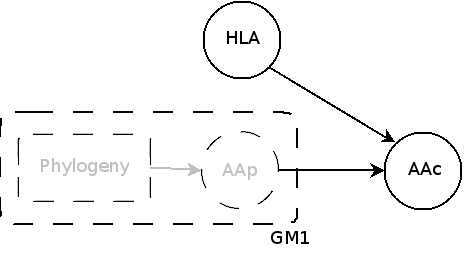
2.a GM1: aa is explained by phylogeny alone
2.b GM2: aa is explained by phylogeny and HLA pressure
3. If GM2 is better than GM1, then HLA is correlated to this particular aa.
GM1
continuous markov model
observed aa
GM2
observed aa in GM1 (AAp)is now hidden, and a HLA node intervenes to give the observed aa (AAc)
Parameters estimated by EM
[Weakness in the Graphical Models Learning]
What biologist want: a set of the most likely associations such that only x% are spurious (ie. completely due to chance)
[Solution Based on False Discovery Rate]
create "null" data (by column permutations) that is guaranteed to have no real associations, and apply method to see how many associatiosn are "hallucinated".
FDR = (# associations for "null" data w/ p-value < 0.001) / (# associations for real data w/ p-value < 0.001)
ie. FDR(t) = expectation(F(t)/S(t)) ~= expectation_nulldistribution(F(t))/S(t)
Computationally intensive (2 days in sequential, 11 minutes w/ 300 nodes cluster just for maximum likelihood.)
Conclusion: using the FDR, it turns out that lost of the previously found correlation were false positives, and more epitope-aa/HLA correlation was found
More associations were found when increasing the amount of data => lots of immune pressure from HLA => a T-cell vaccine is possible
Good vs. bad epitopes:
* good epitope: dead/damaged when the virus escapes attacks
* bad epitope: HIVA mutates after epitope attack, and is still find; immune system attacked this epition, waisting resources in vain
* Compensatory mutations: HIVA mutate at pos1 to escape attack, and at pos2 to re-fit itself => sign of a bad epitope that we don't want into the vaccine
New model: each observed aa is explained by several HLA and aa (instead of just 1 HLA, 1 aa) => phylogeny corrected dependency network
What the biologists wants: how many of the arcs are spurious?
FDR = E((# arcs under null distribution) / (# arcs under real data))
=> On synthetic data: works quite fine
=> On real data (Gag protein): evolution map
Vaccine design:
* evolution map gives good epitope candidates
* verify in the lab
* pack the good epitopes into a vaccine
* test the vaccine
Notes:
* good epitopes vary accross ethinicities / populations
* it seems that some HLA evolve in parallel w/ HIV (=> use phylogeny on HLA as well?)
[Other applications: personalized medicine and genome-wide association studies]
will you get a disease / will the disease recurr / will a treatment work?
Genome-wide association studies:
* correlate phenotype w/ disease/no-disease
* SNP: Single Nucleotide Polymorphism
* very noisy
New model: replace HLA w/ SNP, aa w/ phenotype, phylogenic tree w/ relations between families (represent a family by a hidden node (Gaussian), link related families; phenotype: logistic function; generalized EM)
=> Results on synthetic data: better ROC curve than previous method
Related work:
* Evolutionary biology
(nothing like these models for now)
* Aa co-evolution
cf. Pollock's co-evolution model
* Human genetics
cf. linear mixed models
Conclusion: GM are helping w/ the design of an HIV vaccine (and conversely!)
Tools and models available on the web-site.